Dashboard Layout Widget
A Dashboard Layout widget appears as a tab or section on a type's dashboard page. Dashboard widgets are read-only — they don't edit records. They are used to display summaries, metrics, tables, and charts.
Use useProtrakApi to fetch any data your widget needs to display.
pageContext shape
Source: DashboardCustomWidget.jsx
{
  instanceType,        // Type name the dashboard belongs to (e.g. "Project")
  name,                // Widget's registered name
  displayName,         // Widget's display label
  typeSingularName,    // e.g. "Project"
  typePluralName,      // e.g. "Projects"
  currentWidgetConfig, // Full widget configuration object from Admin (fields, filters, etc.)
  settings,            // Tenant date/time format, file types, etc. — injected automatically
  userData,            // Logged-in user info — injected automatically
}
Note: Dashboard widgets do not automatically receive pre-fetched record data. Use
useProtrakApito fetch the records you need. See the Dashboard Data Fetch Pattern for the standard approach.
Example 1 — Fetch and summarize records by state
Fetch the type's records and count them by lifecycle state.
function ProjectStatusSummaryWidget(pageContext) {
  const { protrakUtils, protrakComponents } =
    React.useContext(customWidgetContext);
  const { useProtrakApi } = protrakUtils;
  const { Container, Spinner, Text, H3, Box } = protrakComponents;

  const getProjects = React.useCallback(
    () => ({
      endpoint: 'instances',
      config: {
        method: 'GET',
        params: {
          instanceTypeName: pageContext.instanceType,
          skip: 0,
          take: 500,
        },
      },
    }),
    [pageContext.instanceType]
  );

  const { state } = useProtrakApi({ requestConfig: getProjects });

  if (state.isLoading)
    return (
      <Container>
        <Spinner />
      </Container>
    );
  if (state.isError) return <Text color="ERROR">Failed to load data.</Text>;

  const counts = {};
  (state.data?.items ?? []).forEach((item) => {
    const s = item.state?.name ?? 'Unknown';
    counts[s] = (counts[s] ?? 0) + 1;
  });

  return (
    <Box direction="column" style={{ padding: '1rem' }}>
      <H3>Status Summary — {pageContext.typePluralName}</H3>
      {Object.entries(counts).map(([s, n]) => (
        <Text key={s}>
          {s}: {n}
        </Text>
      ))}
    </Box>
  );
}
Example 2 — Agreements expiring within 30 days
function AgreementsDashboardWidget(pageContext) {
  const { protrakUtils, protrakComponents } =
    React.useContext(customWidgetContext);
  const { useProtrakApi } = protrakUtils;
  const { Container, Spinner, Text, Box } = protrakComponents;

  const getAgreements = React.useCallback(
    () => ({
      endpoint: 'instances',
      config: {
        method: 'GET',
        params: {
          instanceTypeName: 'Agreement',
          'attributes[0]': 'ExpiryDate',
          skip: 0,
          take: 100,
        },
      },
    }),
    []
  );

  const { state } = useProtrakApi({ requestConfig: getAgreements });

  if (state.isLoading)
    return (
      <Container>
        <Spinner />
      </Container>
    );
  if (state.isError)
    return <Text color="ERROR">Failed to load agreements.</Text>;

  const expiringSoon = (state.data?.items ?? []).filter((item) => {
    const exp = item.attributes?.find(
      (a) => a.name === 'ExpiryDate'
    )?.textValue;
    return (
      exp && new Date(exp) < new Date(Date.now() + 30 * 24 * 60 * 60 * 1000)
    );
  });

  return (
    <Box direction="column" style={{ padding: '1rem' }}>
      <Text>Expiring in 30 days: {expiringSoon.length}</Text>
      {expiringSoon.map((item) => (
        <Text key={item.id}>{item.name}</Text>
      ))}
    </Box>
  );
}
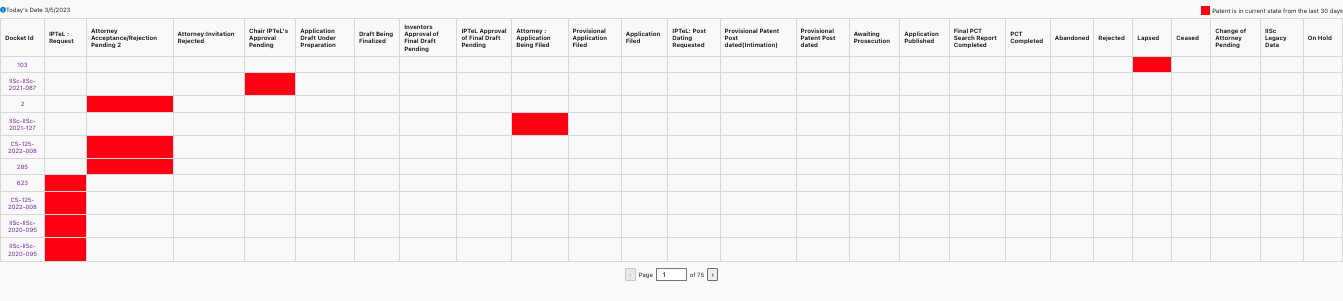
Example 3 — Color-coded alert table
Fetch records and highlight rows that have been in a state for 30+ days.
function AlertTableWidget(pageContext) {
  const { protrakUtils, protrakComponents } =
    React.useContext(customWidgetContext);
  const { useProtrakApi } = protrakUtils;
  const { Container, Spinner, Box, Text } = protrakComponents;

  const getData = React.useCallback(
    () => ({
      endpoint: 'instances',
      config: {
        method: 'GET',
        params: {
          instanceTypeName: pageContext.instanceType,
          'ActivityQuery.Type': 1,
          skip: 0,
          take: 200,
        },
      },
    }),
    [pageContext.instanceType]
  );

  const { state } = useProtrakApi({ requestConfig: getData });

  if (state.isLoading)
    return (
      <Container>
        <Spinner />
      </Container>
    );
  if (state.isError) return <Text color="ERROR">Failed to load data.</Text>;

  const alerts = (state.data?.items ?? []).filter((item) => {
    const activities = item.activities ?? [];
    if (!activities.length) return false;
    const last = activities[activities.length - 1];
    const days = (Date.now() - new Date(last.startTime).getTime()) / 86400000;
    return days >= 30;
  });

  const cellStyle = { border: '1px solid #ddd', padding: '8px' };
  const alertStyle = { ...cellStyle, backgroundColor: 'red', color: 'white' };

  return (
    <Box direction="column" style={{ padding: '1rem', overflow: 'auto' }}>
      <Text>In state 30+ days: {alerts.length}</Text>
      <table style={{ borderCollapse: 'collapse', width: '100%' }}>
        <thead>
          <tr>
            <th style={cellStyle}>Name</th>
            <th style={alertStyle}>State</th>
            <th style={cellStyle}>Days</th>
          </tr>
        </thead>
        <tbody>
          {alerts.map((item) => {
            const last = item.activities[item.activities.length - 1];
            const days = Math.floor(
              (Date.now() - new Date(last.startTime).getTime()) / 86400000
            );
            return (
              <tr key={item.id}>
                <td style={cellStyle}>{item.name}</td>
                <td style={alertStyle}>{item.state?.name}</td>
                <td style={cellStyle}>{days}</td>
              </tr>
            );
          })}
        </tbody>
      </table>
    </Box>
  );
}
Preview:
Tips
- Use
pageContext.instanceTypeas theinstanceTypeNamequery param to stay generic. - Use
React.useMemofor expensive aggregations so they don't recalculate on every render. - Dashboard widgets are visible in the mobile app.
- For deep-dive patterns, see: